

While the price of Ethereum (ETH) is now hovering around $3,900, there may be some selling pressure shortly. According to on-chain data, Ethereum exchange deposits have increased to their highest levels since January 2024.
Increased Ethereum Exchange Inflows
According to data from IntoTheBlock, the quantity of Ether streaming into exchanges hit its highest point since January. The highest net inflows in over four months occurred on Saturday when net exchange deposits reached 140,660 ETH.


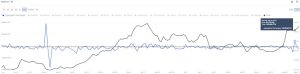
Excessive inflows into exchanges usually indicate selling activity, implying that investors are either taking profits or responding to market-wide fear, uncertainty, and doubt (FUD).
However, a few long-term Ethereum investors have been spotted profiting from the current spike in ETH price. An intelligent money investor recently traded 3,025 ETH for 11.8 million DAI for $3,904 per ETH, generating a profit of almost $1.11 million, according to on-chain data source Lookonchain.
The investor made a substantial profit of almost $59 million when they sold their shares for $3,503 on March 28, 2024. Between 2017 and 2020, the investor acquired 17,770 ETH at an average price of $182 per ETH.
The ETH/BTC Chart Is Still Going Up
The price of Ethereum (ETH) has moved closer to $4,000, but it still needs to cross that mark to validate the positive trend.
According to analyst Tuur Demeester, the Ethereum market euphoria has yet to materialize. Demeester emphasized a critical chart indicating that the ETH/BTC pair “needs to breach 0.06 to turn bullish” in an article published on X on May 25.
When this article was published, the 50-week simple moving average (SMA) offered quick support for the ETH/BTC pair, trading around 0.056. The price must hold this level to raise the possibility of turning the long-term falling trendline (blue) into support. If it happens as planned, ETH/BTC should climb and run into resistance at the 200-week SMA-marked 0.06 level.
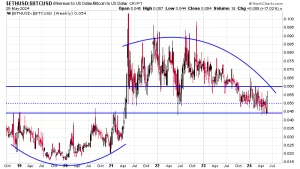
According to the chart below, breaking through this barrier does not ensure the pair will continue on a positive trend. It must still flip the 100-week SMA at 0.063 to validate the breakout.