

The price of Ethereum enters a healthy retracement after an aggressive rally to rekindle buying interest.
A potential correction below $3124, the 50% FIB level, could reduce the buyer’s confidence.


With $34.8 billion in intraday trading volume, ether has gained 58%.
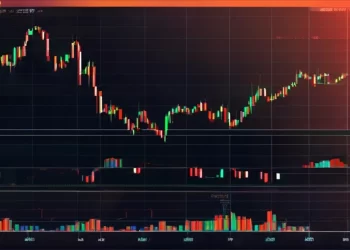
A significant turning point in the Ethereum coin’s recovery trend was reached at $4080, which caused an instantaneous price reversal on the daily chart. The price of ETH fell 10% in just three days to trade at $3666 today. But this retreat beneath the Fibonacci retracement level’s safety net suggests the leading altcoin is ready for more rise.
Why the Market Retraction Won’t Stop Ethereum’s Long-Term Growth

Ethereum, the second-largest cryptocurrency, has been recovering aggressively since late January, as shown by its daily chart’s parabolic growth. With an 88.6% growth rate, this upswing saw a rally from $2166 to a two-year high of $4087.
Ethereum’s transaction fees have significantly dropped, according to the crypto analytics platform Santiment, even though the coin’s price has surpassed $4,000. Today’s average cost is $9.35, a substantial decrease from the $62.85 recorded at the price peak in November 2021.
This decrease is mainly attributable to the Ethereum 2.0 update, which improved network performance. Continued fee reductions could promote ETH adoption across a broader range of use cases.
🤑 The network is less than one-sixth as cheap per transaction as in October and November of 2021, when Ethereum’s market value crossed over $4,000. With gas prices averaging a reasonable $9.35, the enhanced network may be partially blamed for this. tweet.com/bXWmmrqX3L
— March 14, 2024, Santiment (@santimentfeed)
However, the price of Bitcoin fell below $70000, and the supply of other cryptocurrencies, like Ethereum, was noticeably constrained. Nevertheless, in light of the tremendous rally over the last two months, a small retreat helps buyers regain strength for the subsequent higher rally.
Fibonacci Tool Indicates Support Levels for Corrections in the Market
The price of Ethereum is looking for support at the combined support of $3600 and the 23.6% Fibonacci retracement level after a 5.3% intraday decline. This tool draws horizontal lines at key Fibonacci ratios to identify potential levels of support and resistance based on the length of a notable price movement.
Therefore, coin holders must experience enough demand pressure at $3350 and $3124, which correspond with the 38.2% and 50% FIB levels, if the correction trend continues.
Exponential Moving Average is a technical indicator: The 20-day EMA, which moves quickly, offers one more pullback during a market correction.
Average Directional Index: Ethereum may benefit from a small retreat to maintain its bullish momentum, according to the daily ADX, presently at a sharp